
Construct polygon with AutoCAD and Excel
 At the request of an alumnus who missed the class, I answer a question regarding the construction of polygonal lines in AutoCAD.
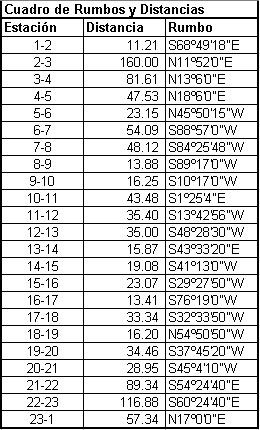
In this case we have a table, in the first column we have the stations, in the second the distances in meters and the third column contains the bearings.
Well, we will proceed to build the traverse, then we will verify the closing error and finally we will talk about the box of bearings.
1. Enter bearings and distances manually.
The nomenclature that AtuoCAD accepts to show the data is known as polar coordinate (distance and course) in the following format:
@ distance <N / S degree d minutes ' the 2nd ”E/W
The values @, d, ', ” are just nomenclatures that the system requires to interpret the data
The N / S and E / W values are for choosing one of each, such as Northeast, you would choose N and E
Bold values are numeric data, the latter can carry decimal values.
If a value is zero it can be ignored
For the case, sequentially it would be of the following form:
- Line command
- Click on a point on the screen
- @11.21<S68D (enter)
- @160<N11d58'(Enter)
- @81.61<N13d6'(Enter)
- ...... enter the rest until the last station
- @57.34<N17dE(enter)
Although this nomenclature is somewhat archaic, since now there are macros and special applications to import data, Autocad veterans prefer to enter it this way due to acquired practice; so I ask for your tolerance, for insisting on understanding the initial concepts, then taking shortcuts. Also, if they knew how we learned this before web 2.0 existed, they would understand why I prefer to share it than keep it in the trunk of memories :).
2. Enter bearings and distances from Excel.
Previously we had seen how Enter UTM coordinates from Excel, only using the "concatenate" function, because this time we will try to use that same function, with the intention that it will serve us to build the table of directions and distances.
The disadvantage of entering the data on foot in the AutoCAD command bar is to make a mistake in a value, and then to be verifying if they were entered correctly. In this case we will see how to use Excel to enter them and then extract them to AutoCAD, without using lisp or macros.
This is an Excel table in which the data has been concatenated.
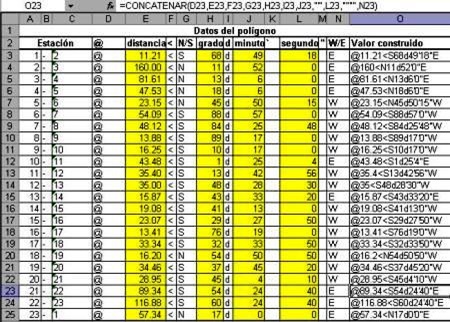
So if you enter the data in the columns marked in yellow, the process is simplified to:
- Line command
- Click on a pounto of the screen
- Select the excel area marked in green, copy (ctrl + c)
- Click on the command bar, paste (ctrl + v)
Ready, your polygon is built, if it is left open or some data seems strange, just check the values entered in the table excel, and do the procedure again without typing each value.
3. Verify closing error
In this case, to verify the closing error, we do the following:
Approach the point where we started, and measure the opening distance between the end point and the start point. This is done with the "dist" command, if in this case it generates 0.20
Now we divide the perimeter (sum of all distances) between that differential. (1,017.66 / 0.20) = 5,088
This means that the precision is one in 5,000, or one meter of error for every 5,000 linear meters. To know if it is acceptable, you must know the acceptable parameters in your locality, generally for urban they are above 1 in 3,000 and for rural above 1 in 1,000.
If the closing error is within the parameters, we must obbligate the polygon closure in one of the lines, preferably in the one of smaller length, this to make sure that the angular error we are applying in the side that will less affect the area of the Polygon ... then we have to correct that course we have adjusted.
If the closing error is outside the parameters, verify that you have entered the data correctly, then verify the field record and finally ... send the surveyor back to the land
4. Construct the table of bearings and distances
 Well this topic we will see in another post when we do it with Civilcad, since in this case we have used Excel to enter the points, so to make matters worse, we just copy and paste the table that is to the right of the archive, Which has concatenated data to just do copy + paste.
It is preferable to use special paste, to choose between autocad entities, ole object, image or block.
Greetings and until next time.
Now comes the educational part of the 2.0 Web, which macros or applications use to enter a table like this?


Send the excel file to editor (at) geofumadas.com to analyze the template.
In theory it should be easy, with the concatenate command.
Send the excel file to editor (at) geofumadas.com to analyze the template.
In theory it should be easy, with the concatenate command.
I have geological structures in an Excel table
A coordinate xyz bearing and dip data and the length of the structure
How do I make a line in autocad?
The idea is to automate this process and not have to draw each structure.
Hello I have data of a geological structure in an Excel spreadsheet xyz the length the heading and the bz I want to take it to AutoCAD and I do not know how to do it.
There has to be a line left in AutoCAD
how to do to pass construction box from autocad
2015 to exel,
how to do to pass construction box from autocad
2015 to exel,
Hello Monica.
We have not tested with curves. You would have to prove how easy it is to enter the arc command from certain data.
Do you know the way to draw a polygon WITH CURVES, taking only directions? Tale with Curve Length, Radius, Rope and Delta. First of all, Thanks!
In the article we clarify that it is for drawing purposes in AutoCAD, without making the correction for each side. As long as it is within the accepted tolerance.
Hello, I understood that if the closing error is within the parameters, we must obbligate the closure of the polygon not in one of the lines, but in all those that form the property or surface that was raised.
These segments need to be treated individually. Even in the boxes of bearings are marked apart, with the name of the curve, radio and rope.
My question sieria that happens when the polygon has curved lines as you draw a curve with data of RADIO ST. LC ,, ROPE ROPE OF STRING AND DEFLECTION
Hello Hector,
Are you indicating a South-South course?
Hello, I need help, I have autocad 2012 and it does not let me insert the coordinates correctly, Diastance @ 35.57 accepts it well but when I go here:
Hector.
Msn; Codepjuniors_2@hotmail.com
I have interest to learn to concatenate course and distance in excel to draw polygon in autocad
Very useful article, helps us to speed work.
Fran, you must concatenate the cells to have the format x, y.
Then activate the line command and paste the concatenated cells.
Manuel.
It is possible that it is working but it is not falling into your workspace.
Try a known coordinate within your space.
Convert the geographical coordinates to UTM, with the respective datum using an EXCEL spreadsheet, copy the UTM coordinates from excel and paste using the autocad _pline command and the traverse does not appear. What can I be failing?
good I installed the civilcad in my machine and I want to draw a polygonal through a sheet created in excell but at the time of copying and paste cadno generates me the drawing but it hits me the cells of excell you can help me not to do thank you
You must convert them to UTM, For that there are different programs and Excel Templates that transform geographic coordinates to UTM. You will need a reference Datum.
Thank you very much if you help me with an answer
I would thank you very much
hello if you could help me I have the data in degrees if you could help me as I put the autocad I have each point as well as this by ejm: latitude 0 ° 1328.95˝S and in length 78 ° 1933.17˝O
What program you downloaded
hello download the data of a total station to my pc and autocad but the details are very agglomerated and the names are large and I do not know how to do with the details one or as I do.
Let's see, in steps:
1. fill in the data marked in the columns before column "O"
2. You select the data in column “O”
3. Activate copy (ctrl + C)
4 In autoCAD, activate the line command
5. You click on the screen to indicate the starting point
6. Activate the paste (ctrl + v)
7. You make esc to finish the command
That should build your polygon, if you do not see it, you zoom in on extent
Thank you very much I am from Honduras and I am presenting the continuation of this project on Monday
Sorry to note that I already have the table as you have it but I do not know how it applies in the excell.
I look at the drawing
I write command line
Click on the screen
But I do not know what I'm going to select or how to do it
Hi, I honestly do not know how to do it. Maybe it will help you to write in Google images the words azimuth and dip and there you will find some kind of work that will take you to some page.
Hello, a little while ago I was asking you how to make a traverse in autocad, I sent you the exel data table but you couldn't help me because you were traveling… .Look, I already have the base of the traverse, an architect friend is helping me but there are two data We do not know how to locate the azimuth of the dip of the layers and the dip of the layers, he knows how to handle the program and made the traverse without this data but how do we do to include this data
Look at the data table that I get
From: tope1
Up to: 2
Distance: 20
Inclination: 4
Azimuth: 240
Heading az: 340
Layer dip az: 70
Layer skimming: 42
And so for other data
Thanks if this is exel and I already sent it
Well, I suppose you can find out what method of surveying they used, it would seem to be a combination of theodolite with a stay or a survey of geological strata. Do you have that in Excel file or just in notebook?
If you have it, send it to the mail and I take a look.
Editor (at) geofumadas.com
Look at the data table that I get
From: tope1
Up to: 2
Distance: 20
Inclination: 4
Azimuth: 240
Heading az: 340
Layer dip az: 70
Layer skimming: 42
And so for other data I have no idea how to do the polygon as I start
Hello I have to do a polygon with the following data and I do not know how it is done
-Poligonal with the profile in jpg or pdf (with scale) and original drawing file (in autocad, corel or canvas)
From distance az inclination of course az from buza-buzami
Of layers as layers layers
And I get the previous full columns
buenisimo
Good I'm new in the forum
This is my query
I did a topographic survey for a route but before I did a traverse, there was a possible error, but the same compensates now as I rephrase that polygon that already compensates for it must be as cement and iron thanks
I am a cartoonist. I use the 2000 autocad for the construction of polygons in cartography planes. It made me crazy when it was a rather complicated polygon. By this I mean the use of polar coordinates to enter complicated distances and angles, until I was fired. lamp; I only decided to enter a point of the coordinate sheet, since the polygon line is formed by 2 points of the space (to forgive the obviousness). Once the points are located, the only thing I have to do is join them with polyline and that's it! I hope it helps them ..
By the doubts I leave my mail to exchange drawing styles:
Markos_elgriego@hotmail.com
Printing is one of the most complicated issues of AutoCAD, in principle I recommend you try to familiarize yourself with printing from the model and not from the layout.
The drawing is built to scale 1: 1, suppose the unit is one meter. The scale is in paper size.
Construct a sheet the size of the paper at 1: 100, which implies that one centimeter will equal 100 centimeters. So if your sheet is 8.5 ″ x 11 ″ convert it to centimeters, it would imply that your frame should measure 21 meters by 28 meters, then remove about two on each side by the margins of the printer and you would have a sheet that is built 1: 100 .
Then if your drawing on this sheet does not fit, take a factor, as applicable, for example double the size would be 1: 200 and half the size would be 1: 50
Then try printing to familiarize yourself with the skills required to understand the printing scale.
If you finally achieve it, then you can break your head with the layout, which requires other scale criteria.
Hello, I want to make the following query, although I do not know if this forum can help me with respect.
It is about giving the scales to the drawings for your printing. Both from the model, and from the layout (with viewports).
Before I want to express some doubts or opinions on this topic.
1. I have visited several sites, forums, pages, etc. Consulting on this subject and just as diverse and varied have been the explanations and answers that I have found in them; From easy and comprehensible solutions to well-worked and step-by-step answers, as well as answers that instead of helping confuse more, etc.
In short variety of answers but in summary explain more or less the same: The procedure to follow to give the scales.
If you want to give a scale 1: 100 proceed as follows:
1 / 100xp if the units of measure of the drawing is in mm.
100 / 100xp if they are in cm
1000 / 100xp if they are in mt.
It is written like this, or in its defect the data that is of the division for each one of the cases and of the scale in question is typed.
Is this correct?
The same process is followed for any other scaling you want to use: 1: 25,1: 200,1: 75, etc.
2. I understand that for the printing of the drawing to come out on the scale or scales (if several drawings), which we have determined; The whole plane has to be drawn to scale 1: 1 (in the model), ie we have to define before making a drawing in which units of measure we will work either mm, cm or mts. This means that the unit of measurement that we determine to work must represent in the drawing the actual measurement of the object to be drawn. Ex. If we have a table with a surface of 1 mt. X 1 mt. The drawing to be made depending on the chosen unit of measurement should be done as follows:
- Draw a 1 x 1 square if we work in meters.
- Draw a 100 x 100 square if we work in cm.
- Draw a 1000 x 1000 square if we work in mm.
Is this explanation correct? I ask because I know that Autcad works by default with mm, however you can change those units that you want to use.
3-Then my doubt arises from the fact that if I want to work in mts. or in any other unit of measure, it is necessary to change the units to mts. or it works as defined by the program (mm); and it is assumed that when drawing "X" object, the measurements that one gives it will be the units that one wants that drawing to have. (either mt. cm, etc.)
Said in other words and taking as ej. The table of 1 mt x 1 mt
If I know that Autocad works with mm. but I want my drawing in mt .:
- Change the units of measure to mts.? or
-I leave it this way and I draw my table giving measurements of 1 x 1 knowing that although Autocad is in mm. the drawing that I make will be in mts?
Do you understand my doubt ?, I hope so.
4-All of the above I expose it because, it turns out that I have several drawings that present this condition, when opening the file the units of the program is in mm. But the measurements of the drawings are in meters. And another that the program units are in meters. And the measurements of the drawing are also in meters. But at the time of giving the scale in the layout eg 1: 50, 1: 75 I do as I explained above (which is the way I found in the different sites I consulted), but it does not work.
The size of the viewport is according to the size of the sheet and it is assumed that when the drawing is already with the required scale it has to fit in the viewport and it turns out that either it is too small or it leaves the window.
What can happen in this case ?.
Well, these are basically the doubts that I have regarding the subject, I hope not to have bored you, inconvenienced, and above all to have taken time since I extended too much I believe, but quite the opposite, I hope to have been quite clear.
If you could clarify the doubts or know of some tuturial, or site that can answer them, would be infinitely grateful indeed.
No problem, we are at your service
It is correct, the polygon, I also think that it must have the rest of the coordinates, the problem is that the information with which I tell or where I can get the rest of the data only contains the coordinates of two points, and the Distances of the segments. As I mentioned.
Anyway I thank you very much, the answer, because the doubt was precisely whether or not you could draw the polygon with only that data.
So thank you very much, and I hope not to bother you if at some point I consult you with something else.
GREETINGS
Let's see if I understood:
You have a polygon, but you only have the coordinate of two stations (I guess the polygon has more)
You have no bearing on the rest, only distances.
No, it is not possible to construct it, you occupy either all the coordinates or have the bearings and distances.
Hello, I want to make the following query, can you draw a polygon in autocad starting from just a couple of coordinates in any station? and if you could do what is the procedure to follow.
Since the problem I have is the following: I have to draw a polygon of “x” number of stations; but the only information I have is a small drawing of said polygon which only has the coordinates "X" and "Y" in two of those stations, and the respective distances of the sections or segments thereof. There is no information on headings, azimuth or anything like that. So the question is, as I mentioned at the beginning, if the drawing can be made with just that information.
I will greatly appreciate the response.
I hope you answer me, look at the construction table, the civilcad gives it to me directly, but I can not find a way to do it more, I hope your help thanks
I do not understand naahh of your example you are missing onnnnnnn if you are going to do something do it right….
Excellent help, thank you very much, you have saved me, because I am drawing a polygon of 38 stations, angles or vertices and I really did not know how to close it.
I had read everything about the different procedures, for example: the angular closure, the linear closure, etc. (With all its formulas), but what I needed was a much more practical solution. Like the one you've given me.
So once again I thank you very much and maybe later you can explain it with an example so that it is registered, and it can serve others that can have the same doubt that I.
Ok, I understand your doubt, I'm pitifully on vacation and I do not ride my heavy equipment. I'll explain it to you in the air.
You have a polygon from point 1 to point 50. It happens that between point 1 and 50 you have 30 open linear centimeters, but should point 50 and 1 be the same.
So you realize that the shortest line is between the 35 and 36 points, so you take all the lines from the 35 point to the 50, and move them.
How much do you move them? Starting from 50 point to 1 point, move command, 50 source point, 50 destination point. This way, your polygon is closed at the end, but it was opened at point 35
So you take the end of that point and move it to the 35 point. It means that you have changed the course and distance of the 35-36 segment, but making sure that it will affect as little as possible the area because it is the shortest
Hi, how are you. I appreciate your valuable help, but I do not want to seem insistent; But I have not been able to fully understand the final part of your explanation where you say:
1.- “you move the entire segment of lines (I suppose you mean the entire polygon) taking the end point as the origin and the start point as the destination”.
According to this indication you say that the aperture would move to the shorter line segment. But I can not understand how this happens.
The modification that you say you have to do in the vertex, I suppose you mean that there is to get the new course of that short segment?
If it is a lot of annoyance I would thank you very much, you could clarify these doubts.
Do you think it could be explained with a graphic example, please
Hi heal
When a closed traverse (in 2D), in the end does not close you, it is possible to find two errors:
An angular error and another linear error. That line segment between the starting point and the starting point is the result of those errors. In practice there will always be error because the angles that we take in the field are always rounded, I mean that although we are using seconds, always that angle had a series of decimals that our topographic equipment forces us to round up and as a consequence, in the end there will always be a error.
Bass basic principles of the topography class, this error must be redistributed between all sides in proportion to its magnitude and for this there is a whole procedure that you should know taking a topography book. Always starting from an accepted tolerance, when we did it to pure calculator, we made so many itineraries until that error was acceptable and now sure that some routines go there to do it or programs that execute it directly.
The truth is that in the end, the entire polygon is modified in very small values so that the error is distributed between all the segments of the polygon.
What I have shown is a practical way to close a polygon, considering first, that it is a "reconstruction" of a traverse that could have already been adjusted. It is more a draftsman's practice than a topographer's who assumes that if you divide the perimeter of the polygon by the linear error it would give you a precision ratio, that is, every few linear meters a meter of error was made and if it is very insignificant (or within of a tolerance) you can close it to the brave.
Assuming that the precision is within accepted parameters, what you do is to identify the shortest side, and you move the entire line segment by taking the end point of the survey and targeting the starting point (the opening segment), this would cause Now the aperture has moved to the shortest segment and then closes the brava by modifying one of the vertices of the short segment.
I have a question: If a polygon drawn from a table of directions and distances does not close (as in the example you present); How is it that the correction of the "closing error" is made?, to make it close.
I make the query because in the example you share, you explain what needs to be done but not how to do it. Maybe you could help me in that sense, because I fully understand what it is that has to be done but not how to do it.
I have read in other forums (and by the way it has not been very clear to me how to do it) about an "angular compensation" (applied to the internal angles of the polygon) and a "linear compensation", to correct closure errors, but I don't know if it is the same as what you mean, since you mention about forcing the closure of the polygon in one of its lines and correcting the course that is affected.
In summary I would like a fairly understandable explanation on how to make this correction taking as an illustration the box of bearings and distances.
I hope I have explained. And hope you can help me
A very big greeting and happiness for such excellent contributions.
That can only be done with AutocAD Map or Civil 3D. I think the normal version of AutoCAD does not have basic functionality like that.
Someday I talked about doing that with AutoCAD 14 and Softdesk 8 There in the comments there is a lisp.
Hello,
My question is this:
After having drawn a polygon with the bearing and the distances, I need to export the coordinates of all the points in AutoCad to excel or to any program, so that I can edit it and present it as a report in a table and not in an AutoCad graphic.
Good morning, I want to know if you can help me with the following:
I would like to pass the information contained in the cell in excel (eg abc), directly to the command line of autoCAD. Be careful without the need for Ctrl + C and Ctrl + V… that is, the association of that cell is automatic and that AutoCAD knows that said information goes directly to the AutoCAD command line. Without more than making reference and waiting for prompt help from you, he says goodbye
Atte. Fulanito Detal
I put into practice the exercise of constructing a polygonal from a table created in Excel, I just had to change the commas for the point and W for the O ..., and it came out perfect, I also practiced with the points or coordinates and take from excel to autocad, it came out perfect ... very grateful for your contribution.
Greetings from Paraguay
they are the best .. they went over ... .. they have helped me a lot
kisses to everyone
Try first to make the polygon that is in the example, and tell me if you get the same
You are right, there is no green column. You must copy the content of column “O” once you activate the point command, and assign the first point of origin with the mouse.
hey I work with autocad 2006, and when I give copy and paste to the data of the excel table the polygon is formed but the lines are disordered, and nothing to see that looks like a polygon, I will be doing something wrong, to start with is what I have to copy and paste q I do not see anything in green on the excel sheet.
Mmm, I think you're right, I'll update the table with more space for data
THE TABLES MUST BE LARGER
It would be great, I'm sure I'm going to be sorry….
Thank you
No, for azimuth it would have to be adjusted because the angles should only rotate in one direction with respect to the north.
Perhaps one of these days raise it adjusted for such purposes.
Greetings to all, this magnificent picture can also be used with the data in azimuth ?????.
Thank you
Hello
I'm a novice in autocad, it's really interesting how to make use of these tools since they simplify time.
With respect to the example of the traverse, passing the data of exel (@ distance
Hello Prudy, you talking about this polygon or another?
There is a small segment that is open, in the case of this, by the error that causes the rounding of the seconds, and that I mean with the closing error
In case you are working with another polygon, you might have a big closing error, or a data you are getting it wrong, and that gives you the impression that you are missing a side
When I build the polygonal I always miss the last stretch
regards
Good Diego, There is the template And the explanation of how it is created and used.
all the best
Well, I did not find an existing macro there, but it can be built with Excel ... it will take me a while on vacation but I think it will be interesting.
If the kids bathe in the pool and then fall asleep tired, maybe give me the time in the afternoon.
regards
Hello Diego, greetings to the people of Paraguay.
Well, there are as many ways as counting cows. Begin by counting the horns and dividing them between two, count the legs and divide it between four, or count the cows directly.
The easiest: it is to use AutoCAD Civil 3D or Softdesk because you just have to go to the option that already comes for that, in which you can choose the point of origin and automatically create the table.
The other case is to do it with the competition (Microstation), with an application Visual Basic as shown in this post.
In case you want to do it as you put it, the only thing I see a bit complicated is to export the data to excel and to go in the order we want. But give me a little time to go back to my house, because today begins the holiday of Easter in these places and I have half tempted.
A pleasure to greet Don Alvarez, some time ago for a search that had arrived without wanting to his web and I seemed interesting, both for the contest and for the pleasant way of communicating his science.
I would like to ask you, if you know any script, or some excel framework that will help me do the following: I have digitized in CAD a polygon with its vertices points well identified, and with their respective UTM coordinates. I can perfectly export them to txt to read them in excel.
my question: knowing the UTM data of points 1… N, is it possible to obtain the data of the stations, bearings and distances?
that is to say, that from the data that I provide, point 1 has X… Y…, and knowing that point 2 has X… Y…; CAN YOU TELL ME THE DISTANCE THAT SEPARATES THEM AND THE ANGLE OF THE SAME? in order to prepare the corresponding spreadsheet automatically?
Thank you teacher since now
Best regards from Paraguay!