
Level Curves from Polylines (1 Step)
Before we saw how Create contour lines starting from a network of points taken in the field. Now we will see how to do it, from existing curves in a scanned map.
As we did with the Road design, We are going to divide it in steps, so that the post does not leave longer than A fart of snake.
Insert image
For this, if you have marginal coordinates in UTM, the work is much simplified. In this case, the intersections of coordinates close to the ends are identified, if the intersections of the corners were had it would be the best.

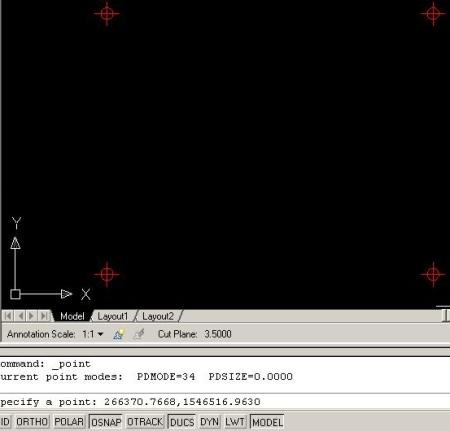
266380,1546430
266480,1546430
266380,1546510
266480,1546510
The points are inserted with the command point, and entering the coordinate separated by a comma, as shown in the image below. To change the point format to a symbol that is visible, it is done from Format> point style. But since these versions of Civil 3D make it difficult to find the menu Tools, you can write to the old: Ddptype From the command line, then enter And choose the type of point.
In this strange part Microstation, where a point is a line of zero length, and can have dynamic thickness with the map view.
Now insert the image, using Insert> Raster image refference. We leave you enabled the possibilities to place the Insertion point y stairs From the screen.
Then place a point to the left of the coordinates and move the mouse until you can see that the image is the approximate size.
If the image covers the dots, send it back. This is done with Tools> Display order> Send to back.
Georeferencing the image.
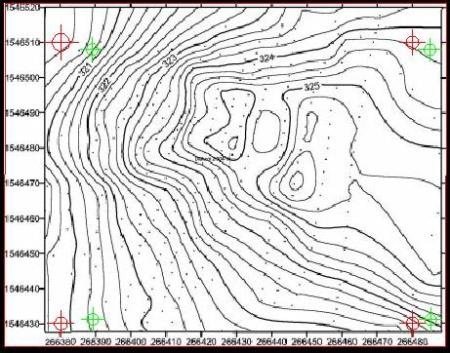
We are going to need points on the image that are equivalent to those that we have entered using coordinates. For that, we join the marginal lines, in order to find the intersections.

Using the command Map> Tools> Rubber Sheet, As we used it a few days ago to Transform vectors, we indicate the green point as the base, then the red one as a reference. When we have already done it with all four, then we do enter and the command asks us to select the objects to transform. We write the lyrics S, For the option Select, And touch the image, then we do enter For the last time and there we have it.
Quite similar to what the Warp of the Raster Manager in Microstation. As we explain it when to Georeferencing pictures of Google Earth.
See how now the image matches the red dots, the green ones can be eliminated. Now the image is georeferenced and at the appropriate scale to start the digitization. In this link it is You can see step 2 To complete this exercise.


Oops, I did not realize there was no link to the next step. At the end of the post I indicated how to see the article where the complement of the exercise is mentioned.
A greeting.
Very interesting, these commands I use daily. The following steps to get curves from a scan, how do I get them?
Thank you
Hi, very interesting this topic. How can I download this useful information?
Thank you
True, it just rotates, scales and moves. There is no deformation beyond that, as I have seen.
Hello hello… This topic is interesting, honestly I have never used that “Rubber Sheet” command.
When performing a georeferencing with this command, if it distorts the image? O Only performs an image scaling.
Also according to the autocad documentation, it is only possible with maximum 4 points (in the case of area) is it true? What happens if the image is distorted towards the center of the image?
http://docs.autodesk.com/MAP/2010/ENU/AutoCAD%20Map%203D%202010%20User%20Documentation/HTML%20Help/index.html?url=WSCAC5A59E50ECFD479C0BA234BD20FE88.htm,topicNumber=d0e141929